Power BI dashboard showing sentiment analysis of customer survey comments with overall sentiment score, percentage of negative feedback, and category-level sentiment trends.

Building a Sentiment Analysis Model from Qualitative Text Using Python NLP

Organizations frequently collect large volumes of qualitative feedback through surveys, customer comments, and operational notes, yet much of this information remains underutilized because it cannot be easily integrated into structured analytics workflows. In this project, I developed a Python-based natural language processing pipeline using libraries such as NLTK, spaCy, and scikit-learn to transform unstructured text data into structured analytical features. The workflow extracts sentiment signals and thematic patterns from raw qualitative responses, enabling the data to be aggregated, quantified, and aligned with operational performance metrics.

By converting subjective feedback into measurable indicators, the analysis allows qualitative customer experience signals to be incorporated into KPI reporting and decision-support dashboards, providing leadership with a more complete view of operational performance.

PROBLEM

While quantitative metrics such as conversion rates, operational throughput, and service KPIs provide important signals about system performance, they often fail to explain why performance is changing. Many organizations attempt to address this gap by collecting open-ended survey responses and customer feedback; however, qualitative text data is inherently difficult to analyze at scale.

Manual review processes are slow, subjective, and impractical when datasets grow to hundreds or thousands of responses. As a result, valuable context about customer experience and operational issues often remains buried within unstructured comments, disconnected from the quantitative performance metrics used in executive reporting.

This creates a critical visibility gap where organizations can detect performance changes but struggle to understand the underlying drivers behind them.

OBJECTIVE

The objective of this project was to develop a reproducible workflow that converts qualitative customer feedback into structured sentiment metrics. Using Python and natural language processing techniques, the goal was to process raw text responses, classify sentiment, and produce an analytical dataset that could be integrated into reporting tools. This approach allows qualitative feedback to be measured, aggregated, and visualized alongside traditional performance metrics.
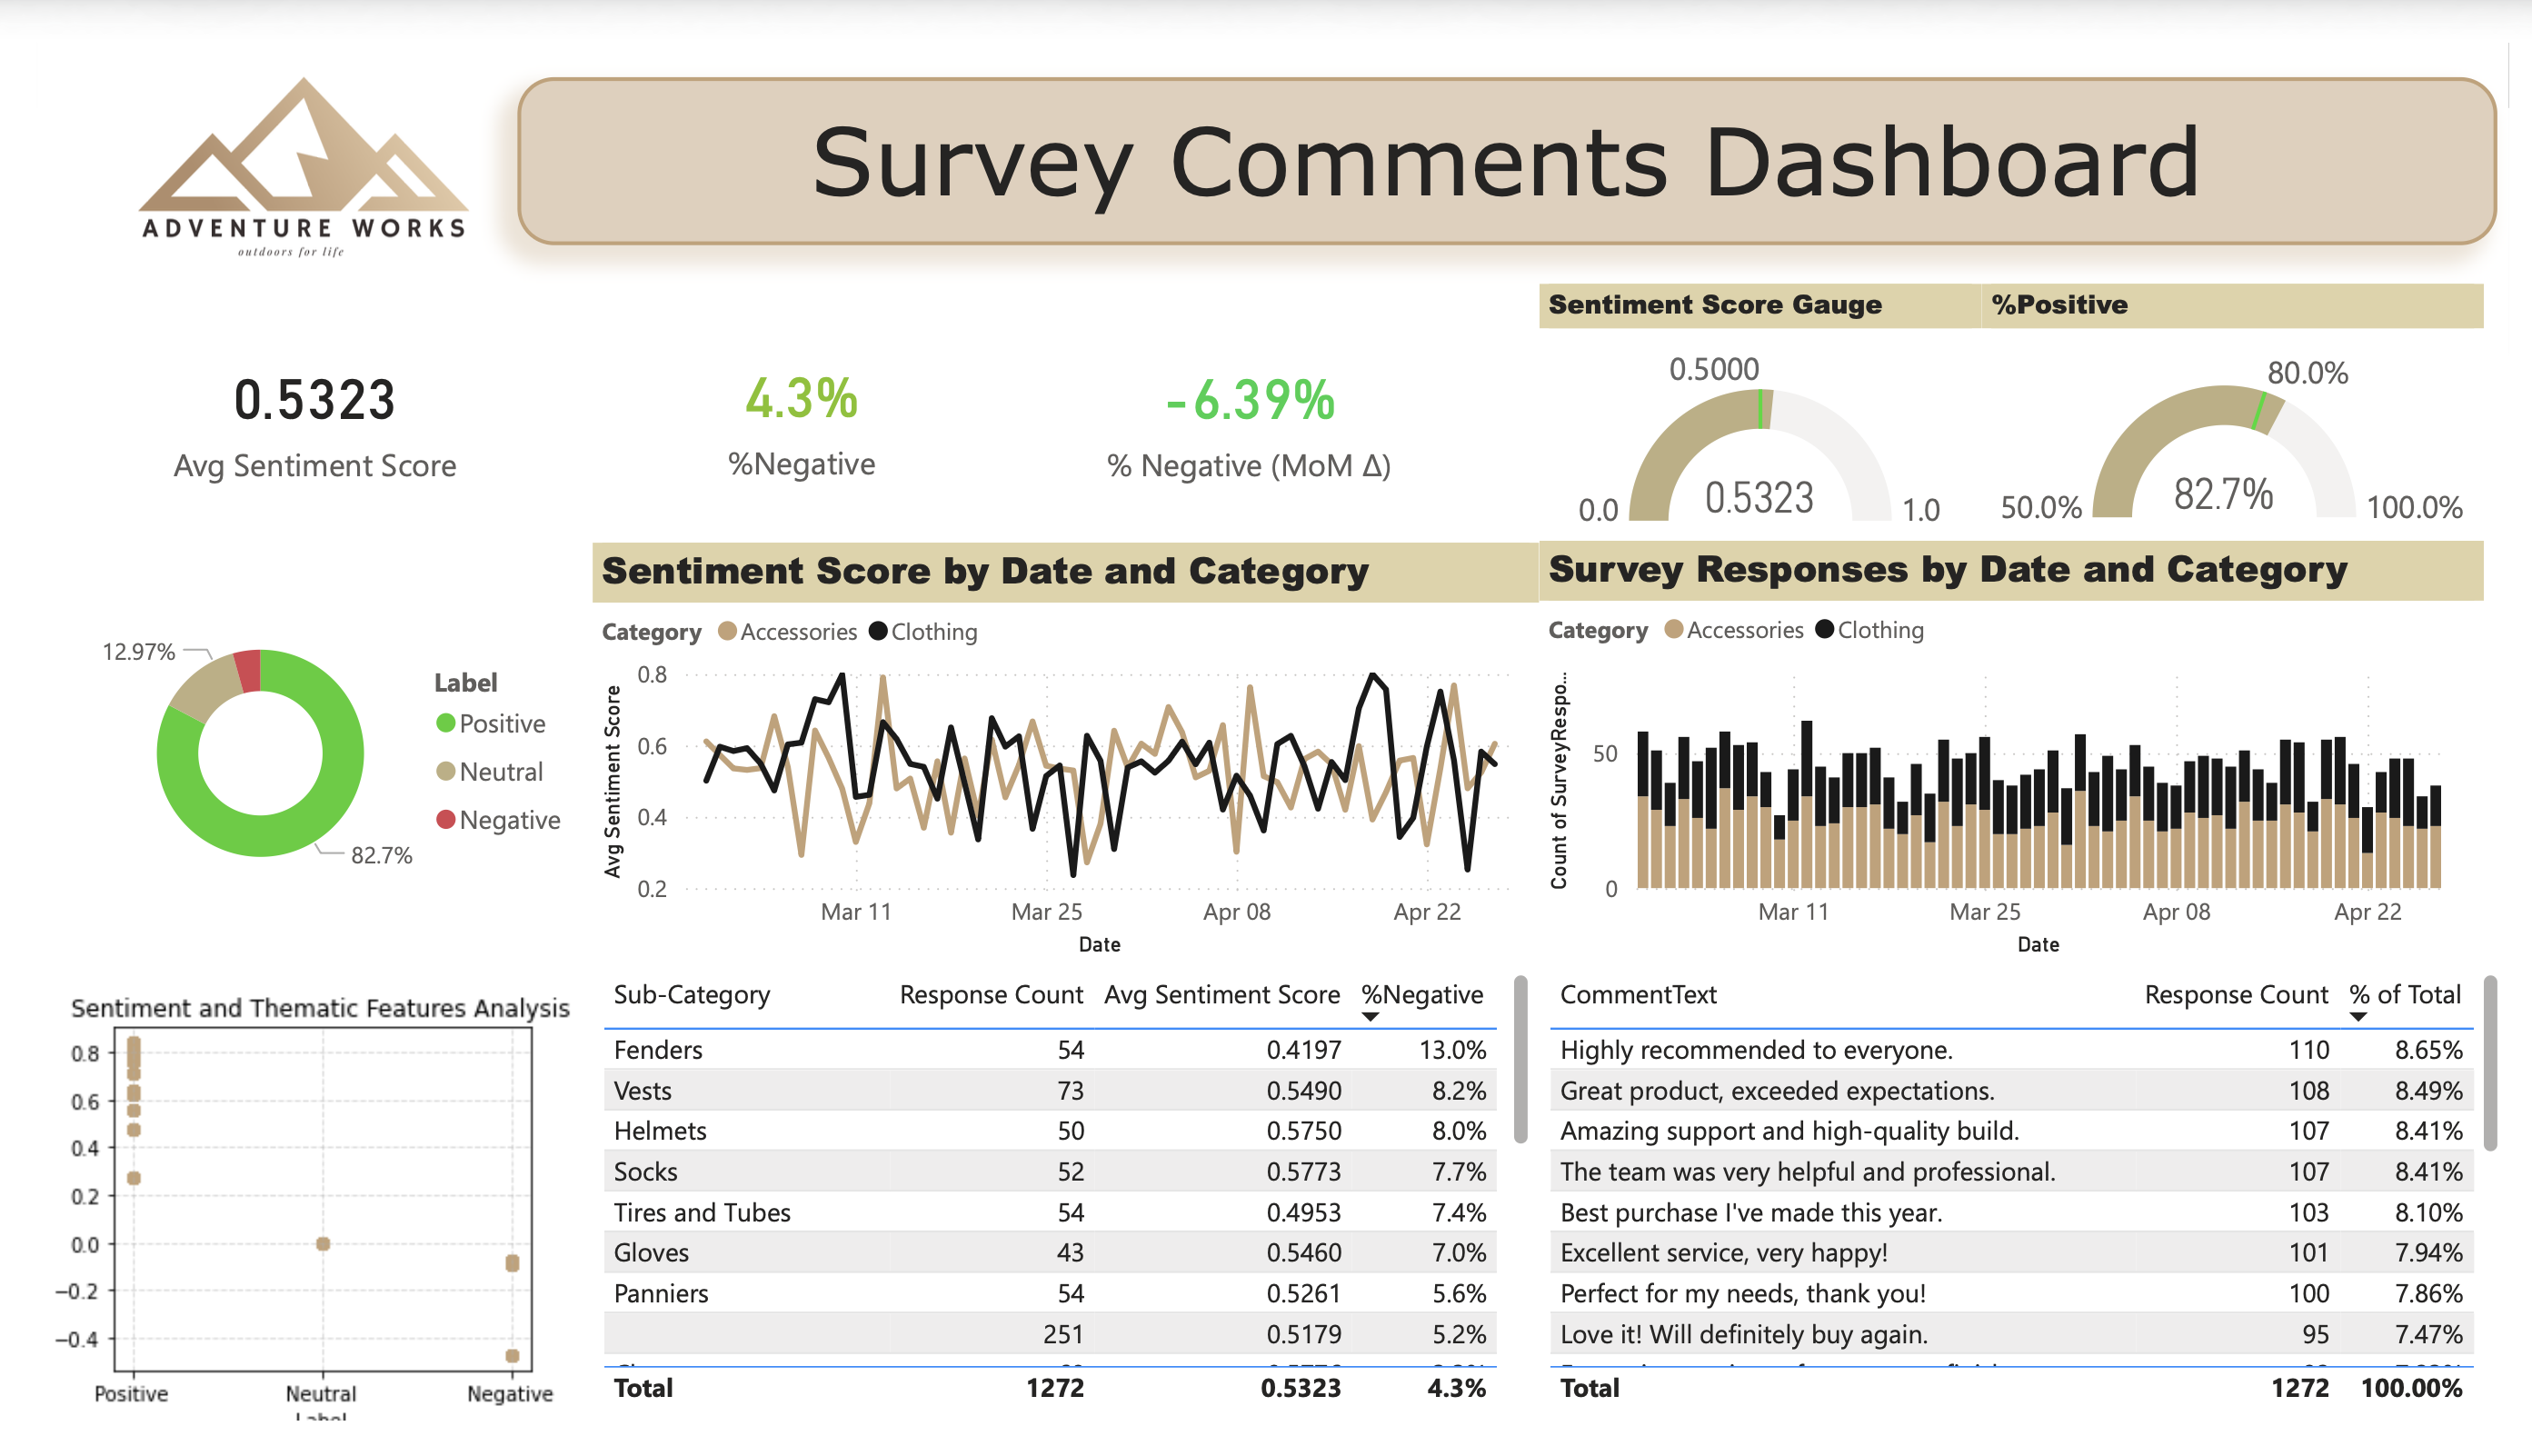
STEP-BY-STEP APPROACH

  1. Define the business question and labeling strategy
    • What do you want to predict: positive/neutral/negative, a -1 to +1 score, or emotion categories?
    • Decide how you’ll get labels:
      • Use an existing labeled dataset (fast)
      • Hand-label a small sample of your own comments (best for domain fit)
      • Use weak labeling rules to bootstrap, then refine
  2. Collect and structure the text dataset
    Create a table where each row is one comment:
    • comment_id
    • comment_text
    • metadata you’ll want later (date, product/service line, channel, category, customer segment)
    • optional: label if supervised
  3. Clean the text (lightly)
    You want consistent text, not sterilized text.
    • Typical steps:
      • lowercase (optional)
      • remove extra whitespace
      • normalize punctuation
      • handle HTML, emojis (convert to words if useful), and weird encoding
      • remove obvious junk rows (empty, “N/A”, “.”)
  4. Normalize language with NLP preprocessing
    Using spaCy (common choice):
    • tokenize
    • lemmatize (better than stemming)
    • remove stopwords (sometimes—be careful)
    • handle negation (very important): “not good” ≠ “good”
  5. Establish a baseline sentiment model; this gives you an initial sentiment score or class:
    Start with a baseline so you have something to beat:
    • VADER (great for short informal text)
    • TextBlob (quick baseline)
    • Or a pre-trained transformer sentiment model (strong baseline)
  6. Build a domain-specific supervised model (if you have labels)
    If you can label even ~300–1,000 comments, you can build something solid:
    • Split train/test (and ideally validation)
    • Convert text → numeric features:
      • TF-IDF (very strong baseline for classic ML)
      • n-grams (catch phrases like “customer service”, “too expensive”)
    • Train a classifier:
      • Logistic Regression
      • Linear SVM
      • (Optional) Gradient boosting
  7. Evaluate with the right metrics
    Don’t just report accuracy.
    Use:
    • Precision/recall/F1 (especially for negative class if it’s rare)
    • Confusion matrix (shows what you’re misclassifying)
    • Calibration (if you output probabilities)
    • Error analysis: read misclassified examples and fix root causes
  8. Add thematic feature extraction:
    Sentiment alone isn’t enough—you want why:
    • Keyword extraction (TF-IDF top terms by sentiment bucket)
    • Topic modeling (LDA / BERTopic)
    • Rule-based tagging for operational themes (billing, wait time, staff, quality)
    • NER (named entities) if useful
    Output:
    • sentiment_score
    • sentiment_label
    • themes / topic_id
    • top_terms
  9. Aggregate into decision-ready KPIs:
    Turn row-level predictions into metrics leaders can use:
    • % negative / neutral / positive by time period
    • sentiment trend over time
    • sentiment by category/subcategory/channel
    • top drivers of negativity (themes + terms)
    • “volume × negativity” (to prioritize what hurts most)
  10. Deploy the pipeline so it’s repeatable:
    Make it production-ish:
    • Wrap steps into functions / a pipeline
    • Version the model and preprocessing steps
    • Save outputs to a table your BI tool can read
    • Add monitoring:
      • input drift (new language)
      • sentiment distribution shifts
      • confidence drop
  11. Visualize in BI tool(Power BI/Tableau):
    Build dashboards around:
    • overall sentiment health
    • trends and spikes
    • drill-down by theme/category
    • “most negative” comment explorer (with filters)
  12. Create an action loop
    This is the “so what”:
    • define owners for top negative themes
    • track interventions
    • measure whether sentiment + KPIs improve after changes

CONCLUSION

Transforming qualitative feedback into quantitative sentiment scores allows organizations to move beyond static survey summaries and manual comment review toward a scalable, continuously updated peak inside the customer experience. When integrated into analytics workflows and reporting dashboards, sentiment trends can be monitored alongside operational KPIs, providing an early indication of emerging service issues or shifts in customer perception that may not yet appear in traditional performance metrics.

By identifying these patterns earlier, organizations can investigate root causes and address service gaps before dissatisfaction spreads through reviews, social media, or word-of-mouth—turning open-ended survey comments into a practical tool for protecting brand reputation and improving service outcomes.

Feel free to reach out!

Thank you! Your submission has been received!

Oops! Something went wrong while submitting the form