This project delivers a unified marketing attribution and revenue intelligence environment for RiseUp Workspaces, a B2B office furniture company specializing in stand-up desks and work environments for medium-sized businesses and at-home offices (created for this simulation, including a custom company brand and logo to replicate a realistic analytics deliverable).
The solution combines a Python-generated marketing, pipeline, conversion, and spend data into a centralized SQL Server model and an interactive Power BI dashboard that evaluates channel performance across the full customer journey. The finished report includes executive performance KPIs, a B2B pipeline view, and a comparative attribution analysis across first-touch, last-touch, linear, and position-based models.
This project was built to simulate a realistic analytics stack rather than a disconnected dashboard mockup. A Python-based synthetic data pipeline uses libraries including pandas for structured data modeling, random for probabilistic behavior simulation, datetime for time-series event generation, and os for dataset management and export. Together these components generate synthetic datasets representing channel activity, campaign structure, marketing touchpoints, pipeline progression, conversions, and daily advertising spend based on defined targets for revenue, marketing spend, funnel volumes, campaign objectives, channel mix, cost ranges, and click-through behavior.
The generated datasets are then loaded into dimensional and fact tables in SQL Server, where attribution views and KPI logic support downstream reporting and visualization in Power BI.
At a business level, the portfolio piece demonstrates how attribution is not a fixed truth but a measurement framework. By holding the same underlying revenue constant and comparing how different attribution models reassign credit across channels, the project shows how performance narratives can change depending on the methodology used. That is the central analytical value of the work: turning marketing reporting from a static scorecard into a decision-making system.
Modern marketing teams invest across multiple channels and campaigns but often struggle to connect marketing activity to actual revenue outcomes. Platform metrics such as impressions, clicks, and conversions show engagement, yet they rarely explain how marketing interactions influence pipeline progression or closed sales.
This challenge is especially pronounced in B2B environments where customers interact with multiple marketing touchpoints before making a purchase decision. Without a unified attribution framework, organizations often rely on fragmented metrics that make it difficult to determine which channels are truly driving revenue and where marketing investment generates the greatest return.
This project addresses that challenge by creating a unified analytics model that connects marketing touchpoints, pipeline progression, and revenue outcomes while comparing multiple attribution methodologies to evaluate channel performance.
The objective of this project was to design and implement an end-to-end marketing analytics environment capable of evaluating channel performance across the full customer lifecycle.
Specifically, the project sought to:
Together, these components demonstrate how a modern analytics stack can transform fragmented marketing data into a cohesive system for measuring performance, evaluating return on investment, and supporting strategic marketing decisions.
The project began by establishing a realistic B2B marketing scenario for RiseUp Workspaces, including target values for annual revenue, average order value, advertising spend, funnel volumes, and total deal count. These targets created the baseline needed to simulate a marketing environment that felt operationally realistic rather than arbitrary.
A Python-based synthetic data pipeline was then built using pandas, random, datetime, and os. This layer handled dataset creation, probabilistic event generation, timestamp sequencing, and CSV export. A fixed random seed was used to make the simulation reproducible across runs.
Next, the core marketing framework was established by creating a channel table and campaign table. Each campaign was assigned to a channel and mapped to a business objective such as demand capture, lead generation, awareness, retargeting, lead nurturing, or promotion. This created the dimensional foundation for downstream attribution and reporting.
The simulation then generated a large synthetic user base and segmented that population into lead, opportunity, and closed-won cohorts. This step made it possible to simulate realistic movement through the funnel rather than treating all users as equally likely to convert.
To make the dataset behave more like a live marketing environment, the model applied weighted channel selection, device distributions, geography distributions, and channel-specific cost ranges. Separate click-through rates were also defined by channel so that impression and click behavior would vary in a believable way across Paid Search, LinkedIn Ads, Display, Affiliate, Email, Organic Search, and Direct traffic.
Using those assumptions, the script created timestamped touchpoint records for each user. Every journey began with an impression, followed by a probabilistic click when applicable, and in some cases an additional retargeting impression. This produced a realistic multi-touch event stream with channel, campaign, device, geography, touch type, and cost stored at the row level.
Once touch activity had been created, the model generated conversion records for the users designated as closed-won. Conversion timestamps were intentionally placed after the user’s final marketing touch so the sequence reflected a plausible customer journey. Revenue values were also simulated within a controlled range to produce realistic order sizes.
After conversions were created, the script generated pipeline stage records for users entering the funnel. These events included lead creation, opportunity creation, and closed-won stages, each with logically ordered timestamps. This step connected upstream marketing interactions to downstream sales progression and allowed the dashboard to analyze both marketing efficiency and pipeline movement.
The raw touchpoint table was then summarized into a daily channel spend dataset. Spend, impressions, and clicks were aggregated by date and channel, creating a clean fact table that could support trend reporting and KPI calculations inside Power BI.
After the synthetic datasets were generated, Python exported the outputs as CSV files for channels, campaigns, touchpoints, conversions, pipeline events, and daily channel spend. These files served as the handoff layer between the synthetic data pipeline and SQL Server.
Inside SQL Server, the project created a dedicated analytics database and organized the model into dim, fact, and stageschemas. Dimension tables were used for channels, campaigns, and pipeline stages, while fact tables stored marketing touchpoints, conversions, daily channel spend, and pipeline events. This established a warehouse-style structure that could support both analytical queries and BI reporting.
The CSV outputs were then imported into SQL Server using BULK INSERT. Dimension tables for channels and campaigns were loaded first, followed by the conversion fact table. This ensured the reference data was in place before the remaining event-level and aggregated datasets were processed.
For the larger and more transformation-sensitive files, the workflow used staging tables before loading the final fact tables. This approach made it easier to preserve column order, validate field mapping, and troubleshoot load issues without contaminating the final warehouse tables.
After the staging loads were complete, the project inserted the staged records into the production fact tables for marketing touchpoints, pipeline events, and daily channel spend. This step finalized the ETL process and made the warehouse ready for attribution logic, KPI views, and Power BI modeling.
Finally, row-count checks and summary validations were performed to confirm that the warehouse reflected the expected dataset volumes and totals. This included validating touchpoint counts, pipeline event counts, and aggregate spend, impressions, and clicks before moving into attribution logic and dashboard development.
After the warehouse tables and attribution views were finalized in SQL Server, Power BI was connected directly to the database. The model imported the core fact tables and supporting dimensions, including marketing touchpoints, pipeline events, conversions, channel spend, campaigns, and channels. Attribution views and KPI views created in SQL Server were also imported to simplify downstream reporting logic.
Within Power BI, relationships were created between the fact tables and their corresponding dimension tables to form a coherent analytical model. Channels and campaigns were connected to both marketing touchpoints and spend data, while user identifiers connected marketing activity to pipeline progression and conversions. This relationship structure enabled cross-filtering across marketing, pipeline, and revenue metrics within the report.
Once the data model was established, a set of reusable DAX measures was created to support the dashboard’s KPIs and visualizations. These measures included total revenue, advertising spend, impressions, clicks, orders, and pipeline counts, along with derived metrics such as cost-per-click (CPC), cost-per-acquisition (CPA), return on ad spend (ROAS), and conversion rates. Centralizing these measures ensured that metrics remained consistent across all report pages.
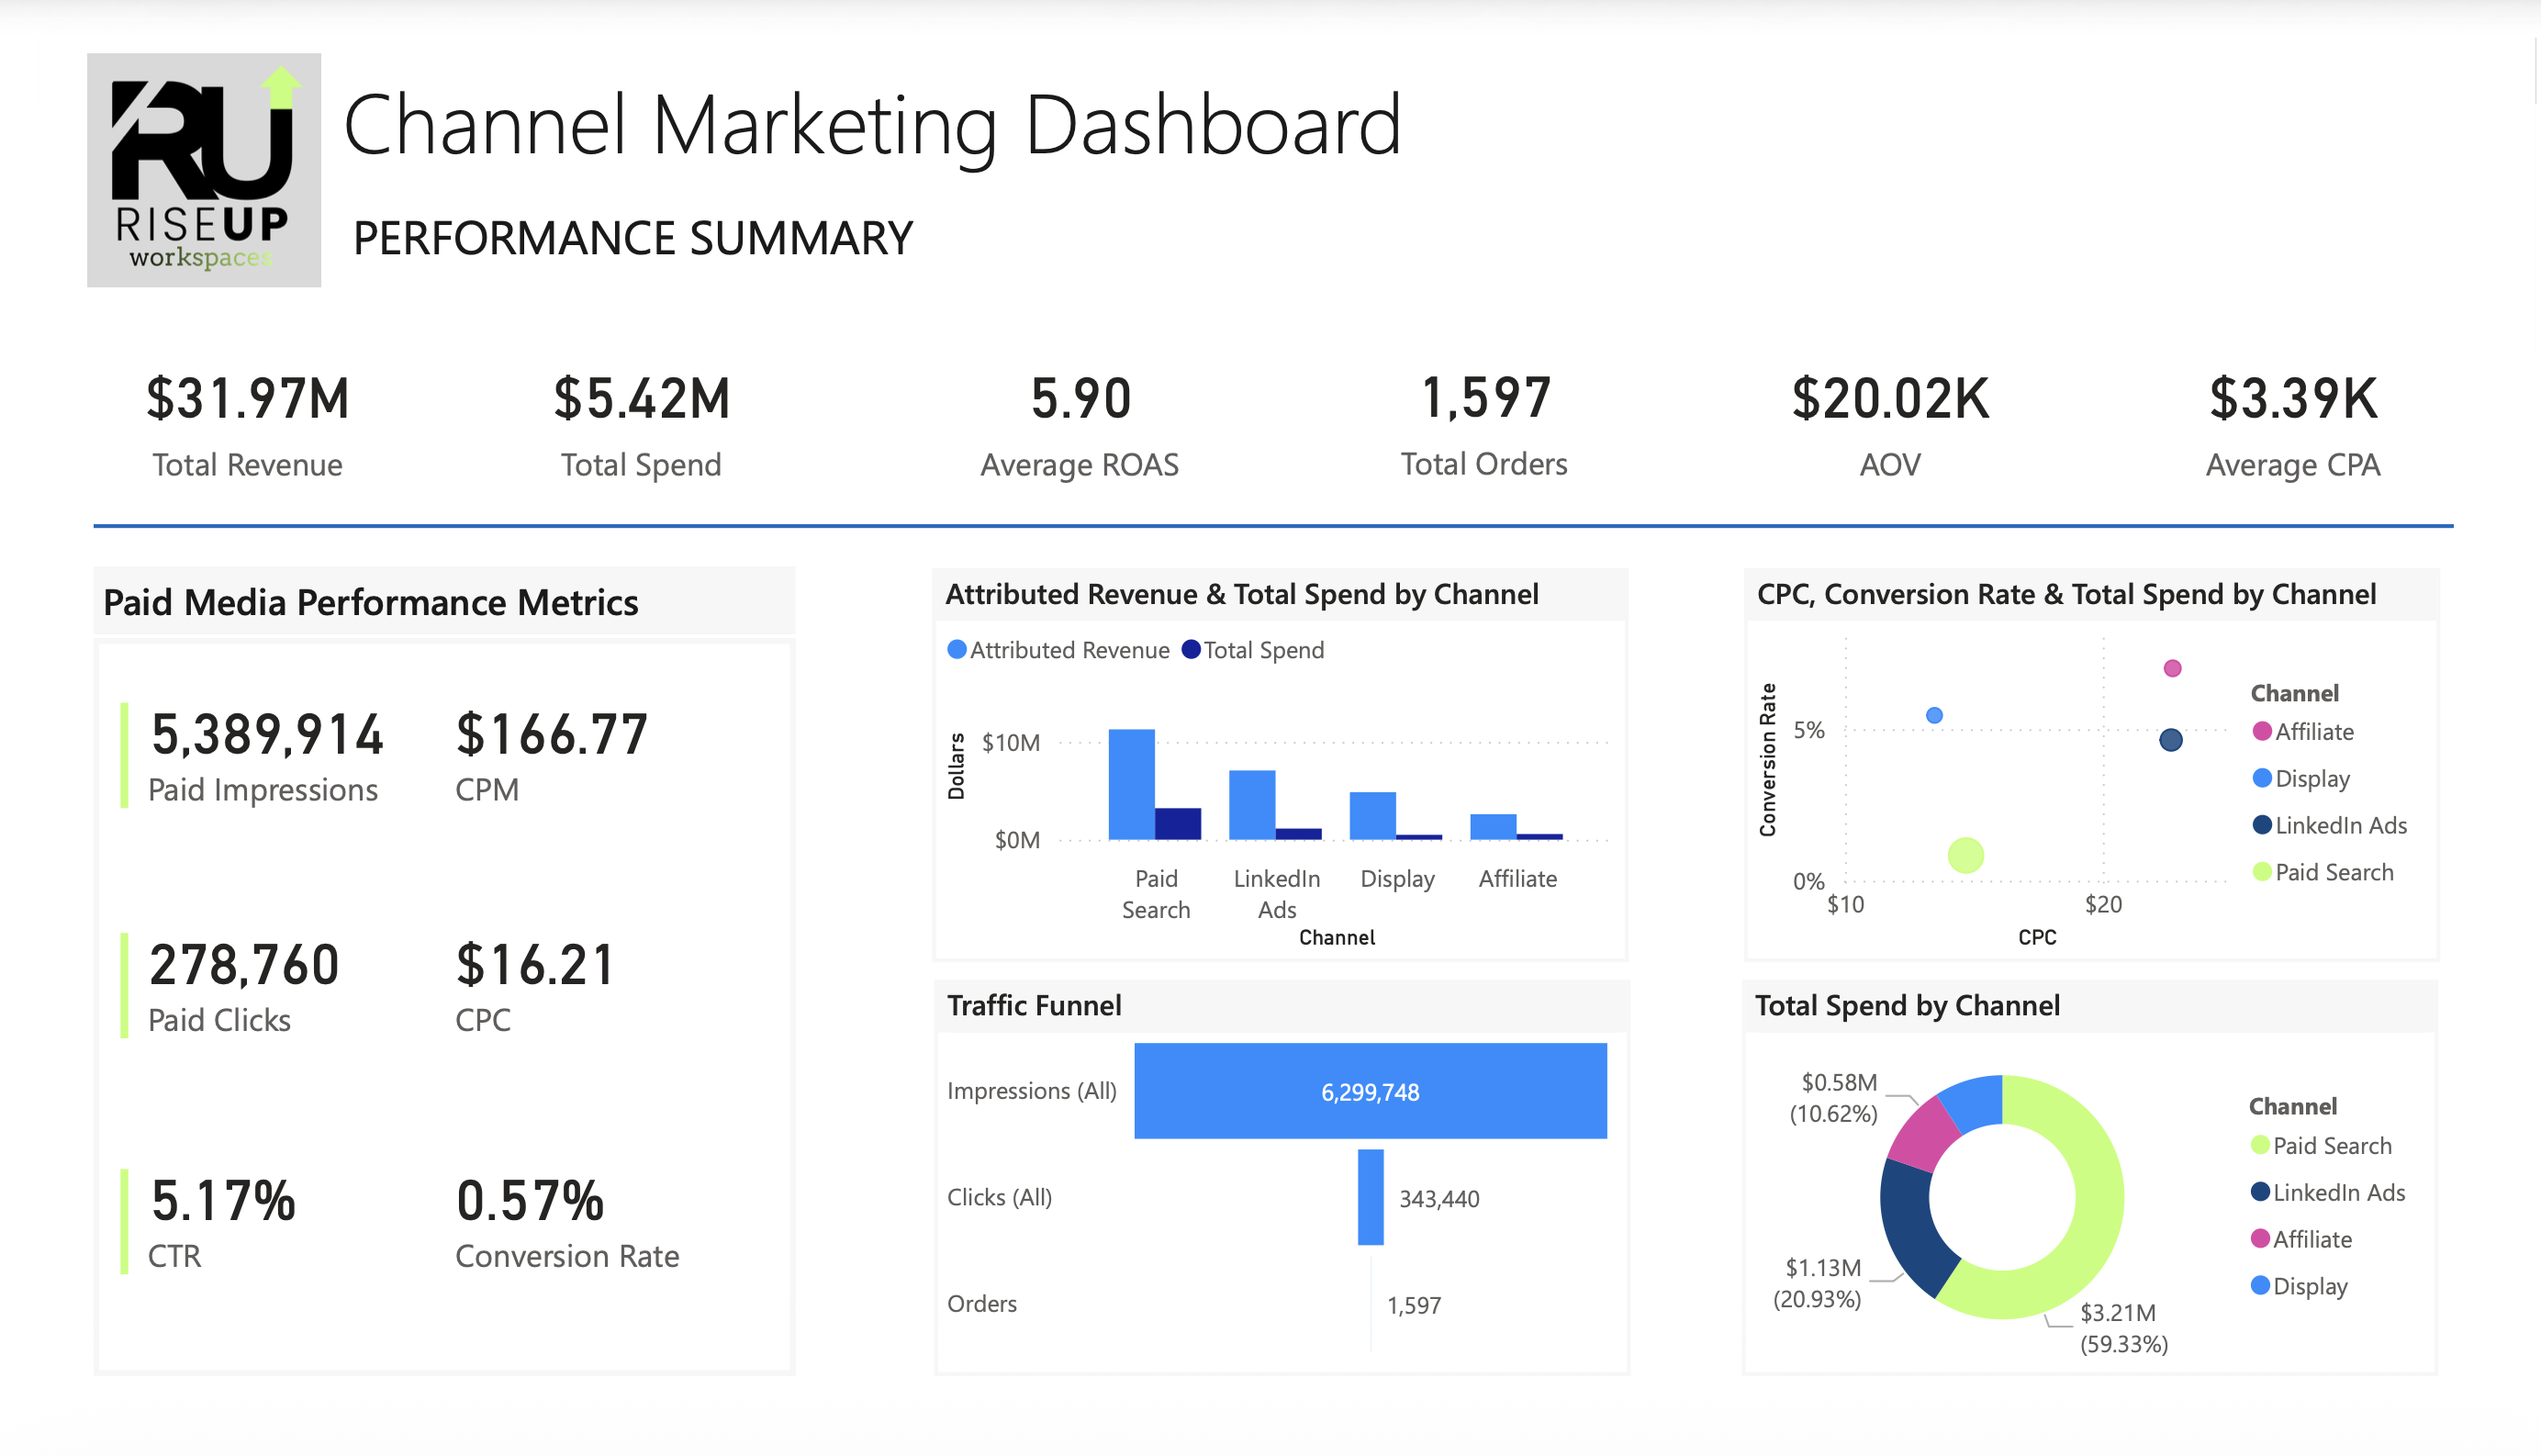
The first report page was built as an executive overview of overall marketing performance. This page features KPI cards summarizing key performance indicators such as revenue, spend, ROAS, CPA, CPC, and CPM. Supporting visuals provide a breakdown of spend, revenue, and orders by marketing channel, allowing stakeholders to quickly assess channel efficiency and identify high-performing acquisition sources.
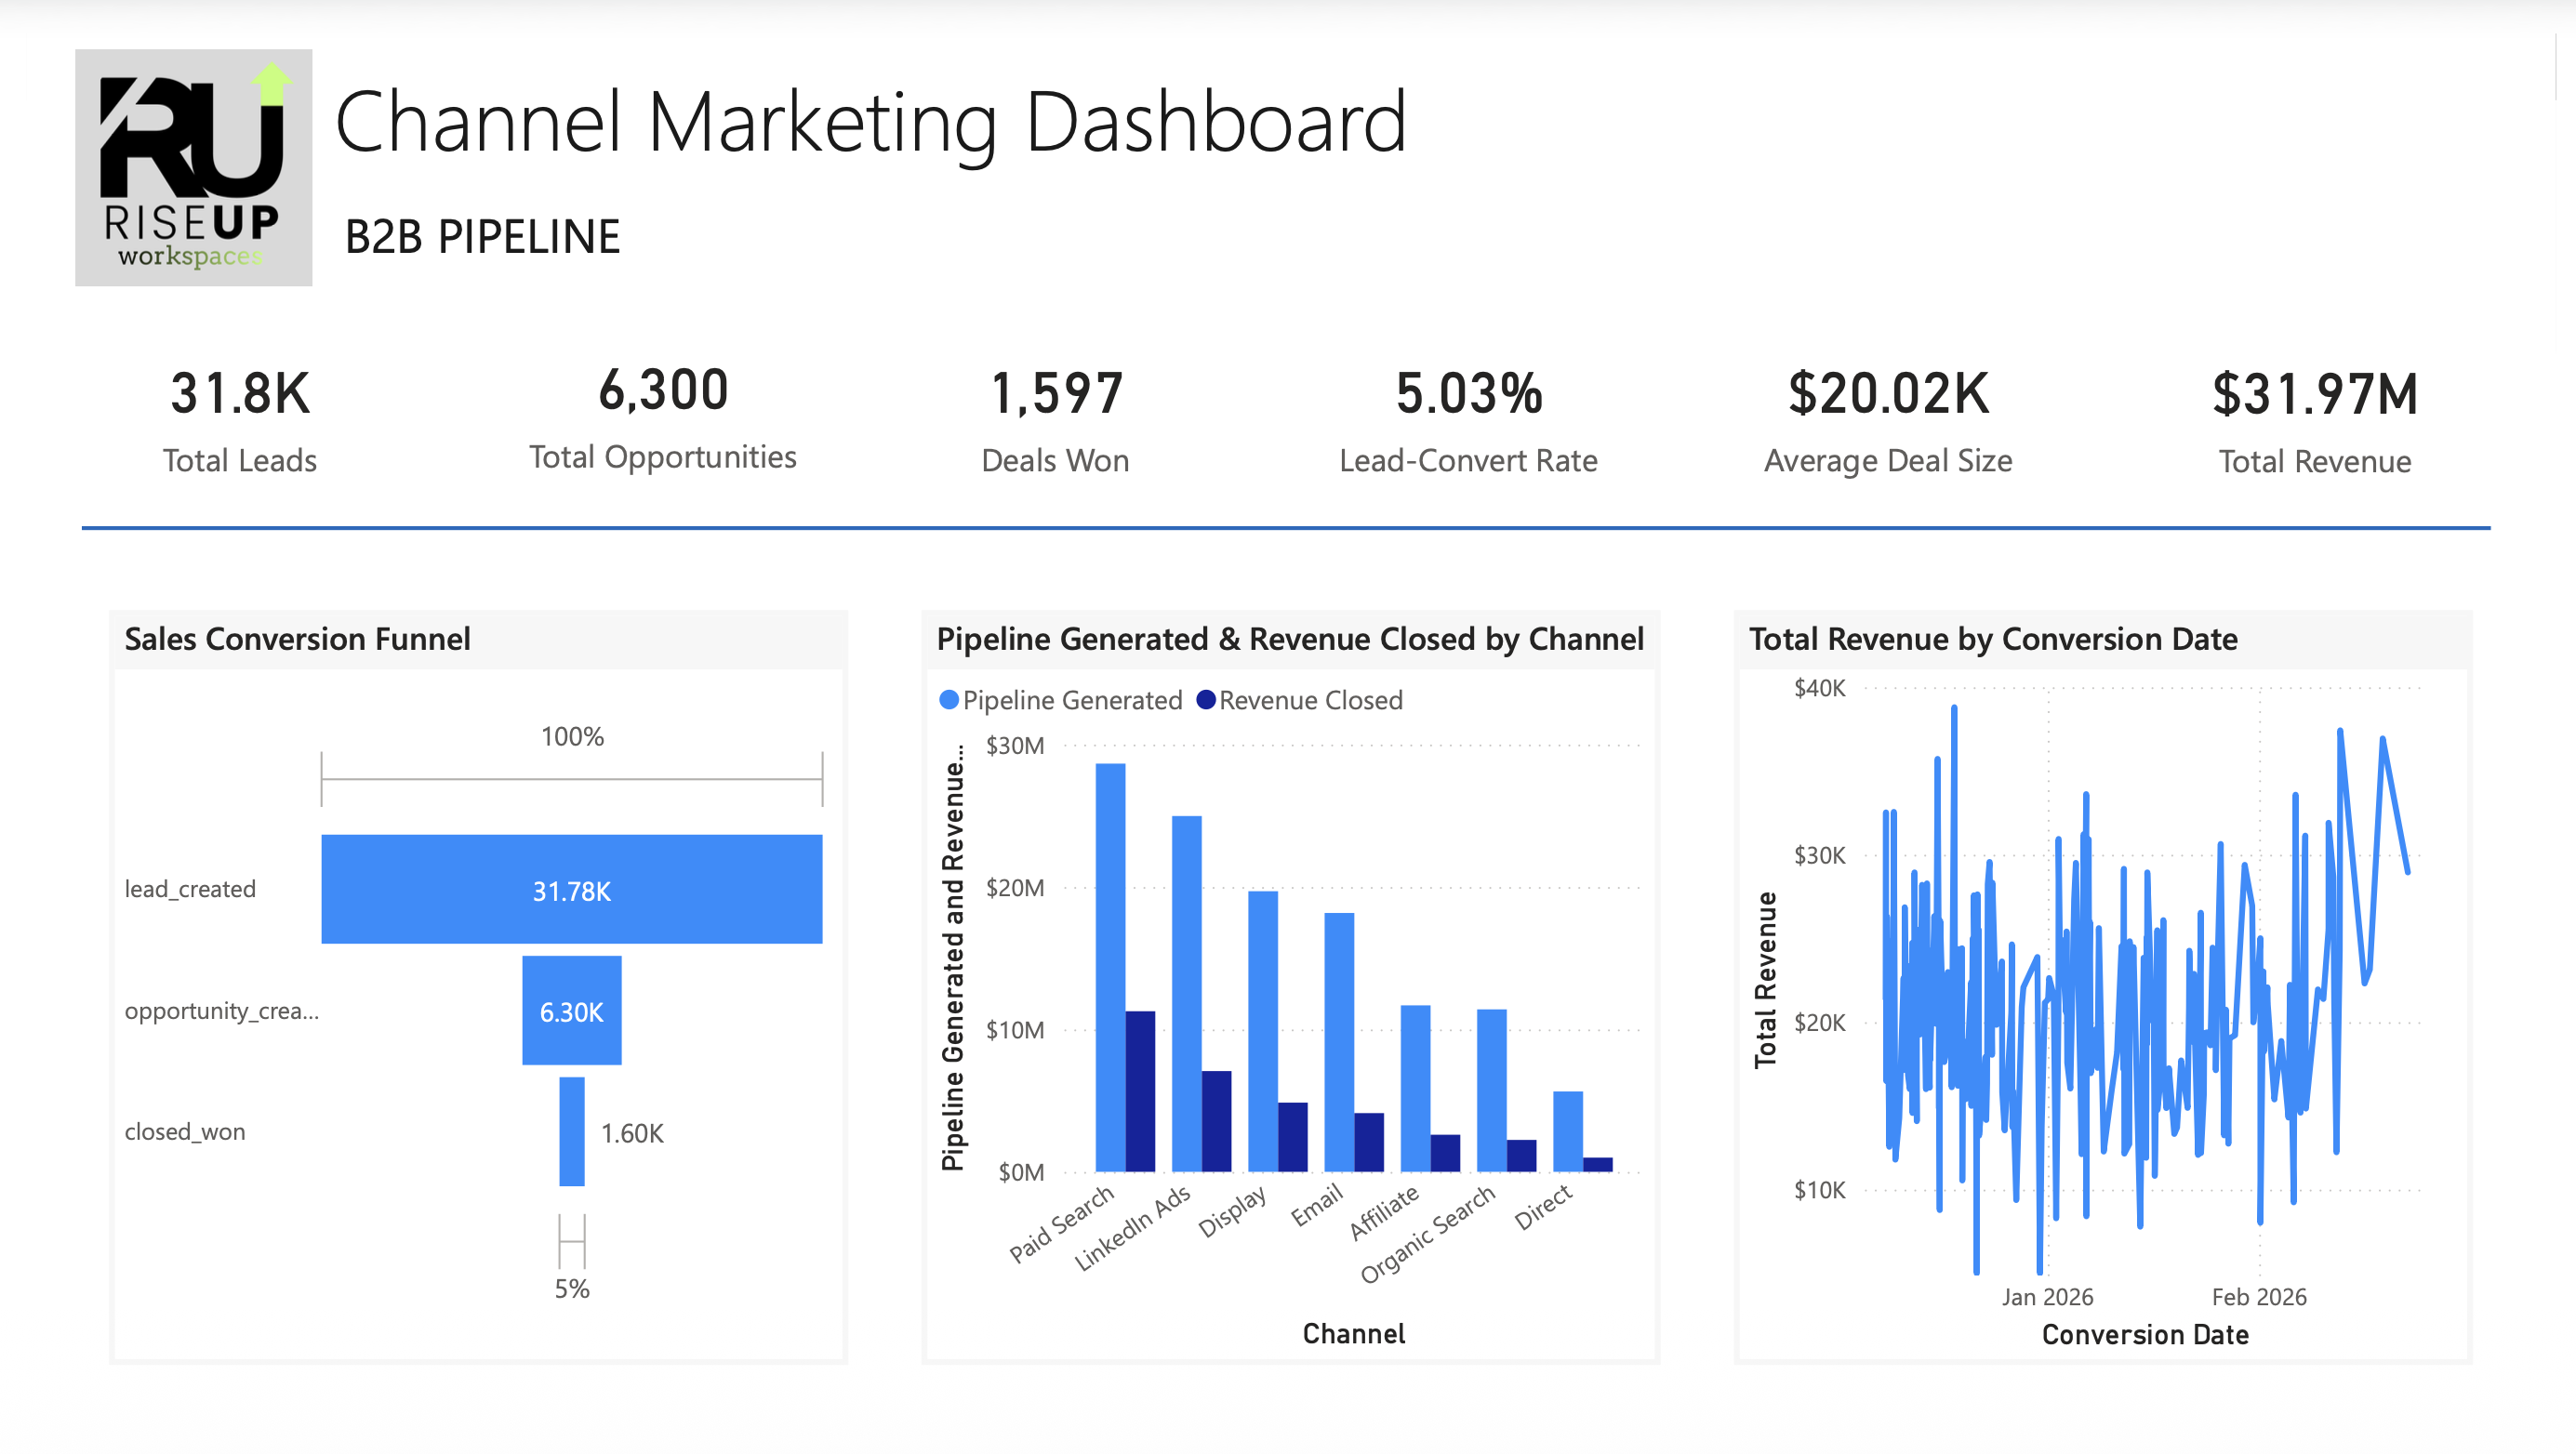
The second page focuses on the relationship between marketing activity and downstream sales pipeline. Visualizations show how leads progress through key funnel stages including lead creation, opportunity generation, and closed-won deals. Additional visuals display the distribution of pipeline outcomes by channel and campaign, helping illustrate how marketing activity contributes to pipeline generation and revenue conversion in a B2B sales environment.
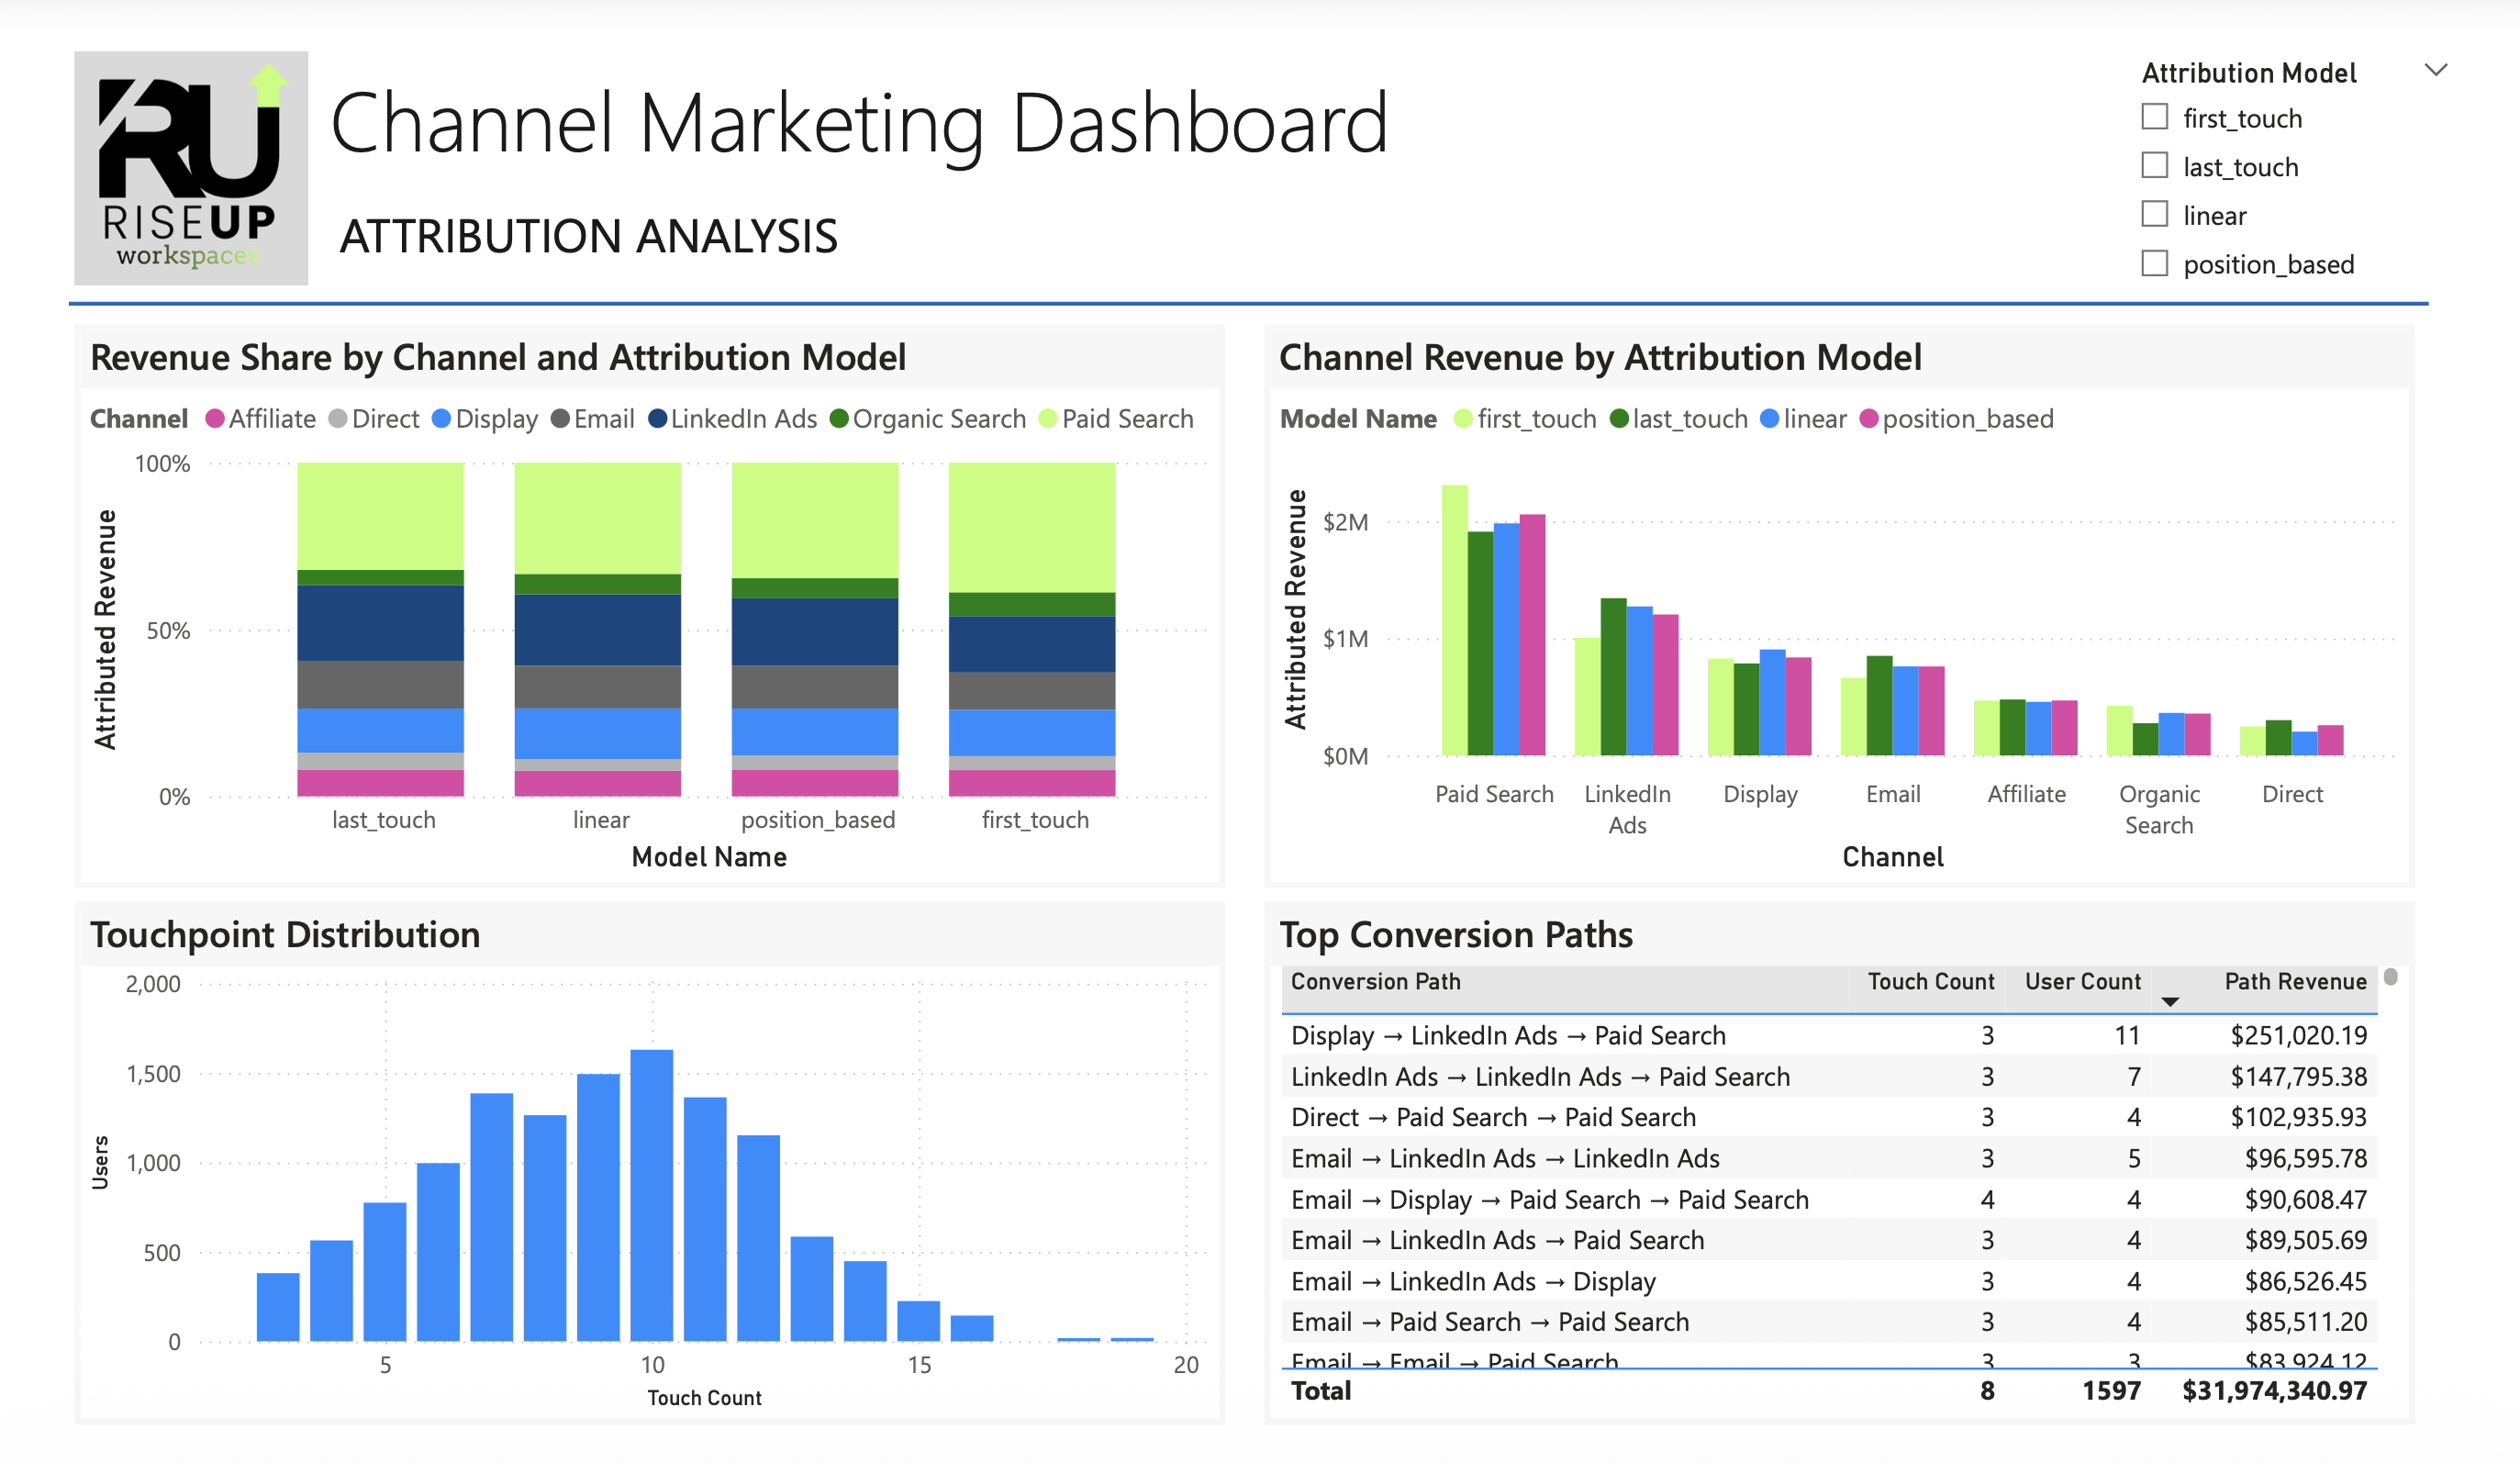
The third report page compares multiple attribution methodologies using the same underlying dataset. Visuals display revenue contribution by channel under four attribution models: first-touch, last-touch, linear, and position-based attribution. Side-by-side comparisons allow users to observe how channel rankings and revenue share change depending on the attribution framework applied.
To further explore multi-touch customer journeys, the attribution page includes a visualization of the most common marketing conversion paths. This analysis identifies the sequences of marketing interactions that most frequently lead to closed deals, offering insight into how different channels interact throughout the customer lifecycle.
Interactive slicers were added to allow users to filter the dashboard by marketing channel, campaign, and attribution model. These controls enable stakeholders to explore performance across specific segments of marketing activity and examine how attribution outcomes change under different analytical perspectives.
Once all visuals were created, the report layout was refined to improve readability and presentation quality. Visual spacing, labeling, and color usage were standardized across pages to maintain a clean and professional design. Channel color assignments were also applied consistently to make comparisons intuitive across different report sections.
Before finalizing the dashboard, KPI values were validated across pages to ensure consistency between channel breakdowns, attribution calculations, and overall totals. This validation process confirmed that metrics calculated in the semantic model aligned with the underlying SQL data and attribution logic.
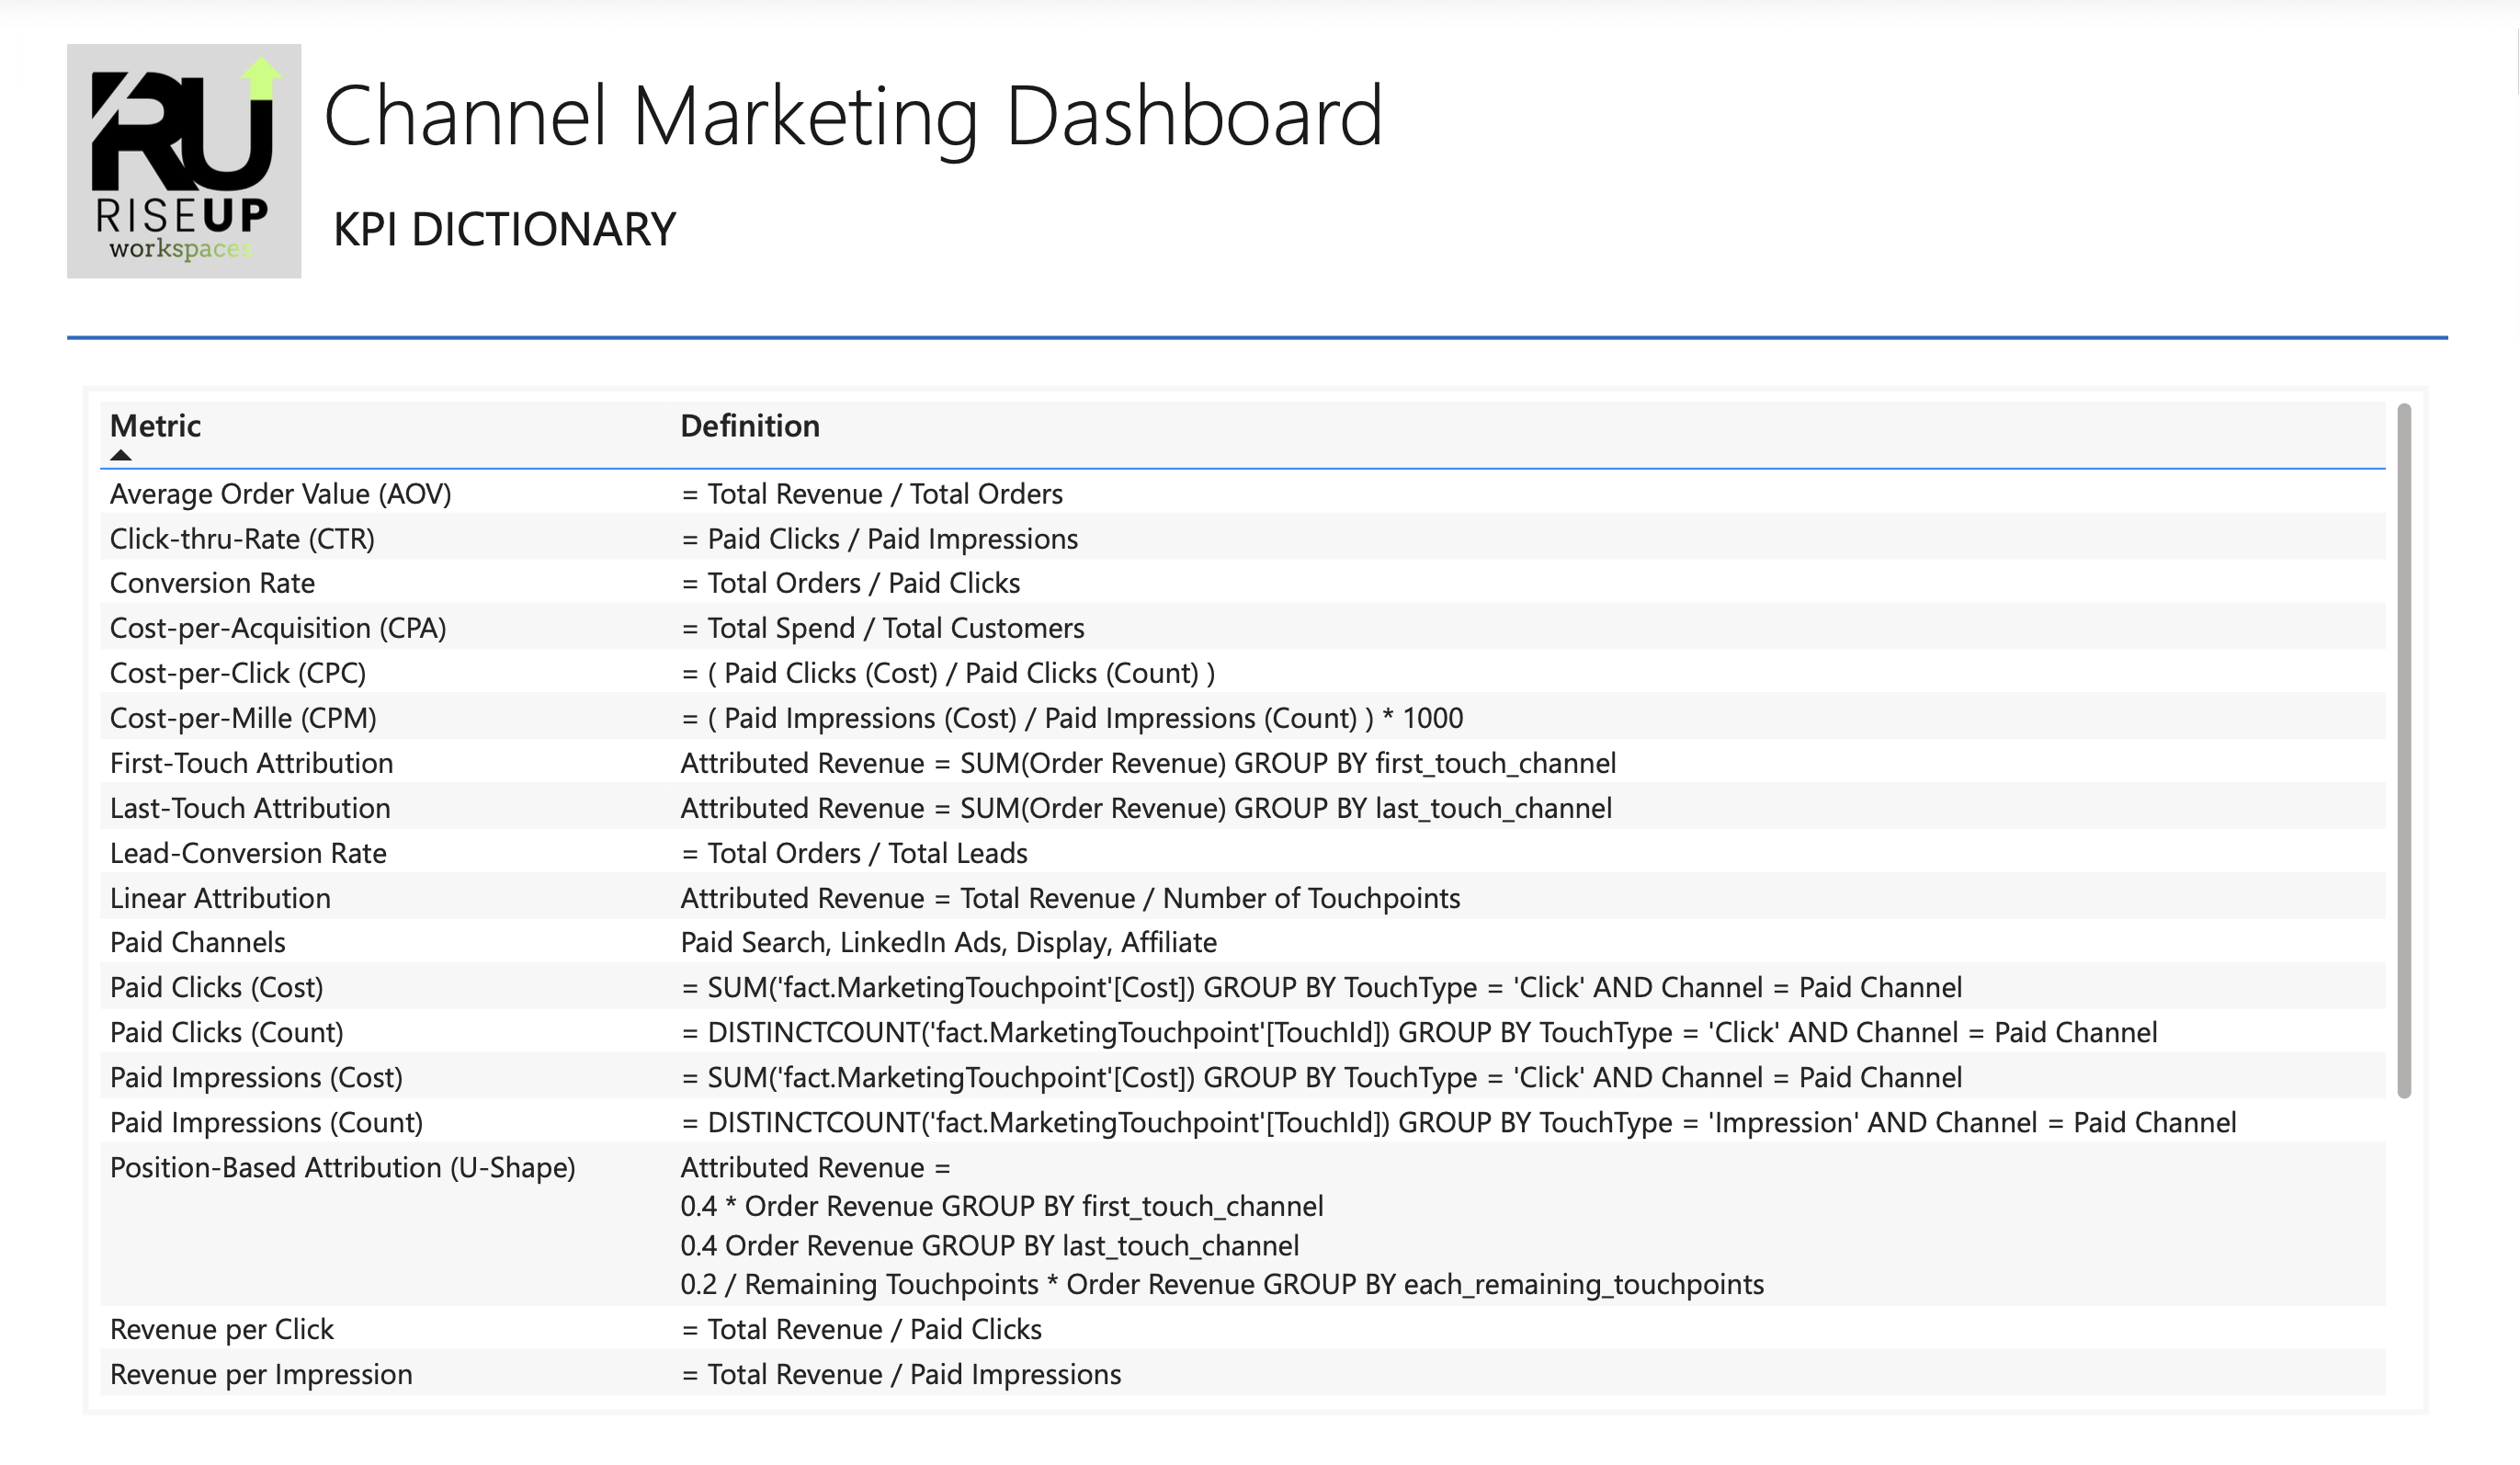
The final step in the project was the creation of a KPI Dictionary documenting the definition and calculation logic for every key metric used in the report. This reference included definitions for marketing performance indicators such as ROAS, CPA, CPC, CPM, conversion rate, pipeline stages, and attribution models. By documenting these definitions, the project ensures that stakeholders interpret metrics consistently and that the reporting framework remains transparent and reproducible.
The unified attribution dashboard reveals several opportunities to improve marketing efficiency and strengthen revenue performance. By combining channel-level performance metrics with multi-touch attribution analysis, the report highlights areas where targeted experimentation and strategic budget adjustments may improve overall marketing effectiveness.
Channel performance analysis indicates that Affiliate and LinkedIn Ads demonstrate higher conversion rates relative to some other acquisition channels. While this suggests these channels may be generating higher-quality traffic, immediately reallocating large portions of the budget could introduce diminishing returns due to audience size limitations, partner inventory constraints, or ad saturation.
Instead, the appropriate next step would be to run controlled budget expansion experiments for these channels. Incrementally increasing spend while monitoring changes in CPA, ROAS, and conversion rate would help determine whether the channels can scale efficiently or whether performance declines once the available audience pool is exhausted.
Some channels currently account for a significant share of total marketing spend while producing lower conversion efficiency relative to other channels. These channels may still play an important role in generating top-of-funnel awareness, but their cost-per-acquisition and return on ad spend indicate potential inefficiencies.
Rather than eliminating these channels, the dashboard suggests an opportunity to evaluate campaign targeting, bidding strategies, and creative optimization to improve conversion performance while maintaining their role in the broader acquisition mix.
The attribution comparison demonstrates that channels receiving limited credit under last-touch attribution often receive more recognition under linear and position-based models. This indicates that some channels contribute earlier in the customer journey by introducing prospects to the brand or reinforcing consideration before conversion occurs.
Understanding this dynamic is important when evaluating marketing performance, as eliminating these channels based solely on last-click metrics could disrupt the full acquisition funnel.
Analysis of conversion paths highlights recurring combinations of channel interactions that frequently lead to successful purchases. These patterns suggest that certain channels consistently work together within the customer journey, reinforcing brand exposure and engagement across multiple touchpoints.
Recognizing these interaction patterns can help marketing teams coordinate campaigns across channels rather than evaluating each channel in isolation.
The comparison of first-touch, last-touch, linear, and position-based attribution models illustrates how the perceived importance of each channel changes depending on the measurement framework used. This reinforces the importance of evaluating marketing performance from multiple attribution perspectives rather than relying on a single model.
Using multiple attribution views enables leadership to better understand how different channels contribute across awareness, consideration, and conversion stages.
The most important outcome of this project is the creation of a unified analytics environment that connects marketing activity, pipeline progression, and revenue outcomes within a single reporting framework. By integrating these data sources, the organization gains a clearer view of how marketing investments translate into revenue and can evaluate optimization strategies with greater analytical confidence.
This project demonstrates how a modern analytics stack can transform fragmented marketing activity into a unified system for measuring performance and guiding strategic decision-making. By combining synthetic data generation in Python, structured data modeling in SQL Server, and interactive reporting in Power BI, the solution replicates the type of analytics environment many organizations rely on to evaluate marketing effectiveness.
Beyond the technical implementation, the project highlights the importance of measurement frameworks in shaping how marketing performance is interpreted. Comparing multiple attribution models reveals that perceived channel effectiveness can change significantly depending on how revenue credit is assigned, reinforcing the need for thoughtful analytics design rather than relying on a single metric or reporting perspective.
Ultimately, the unified attribution dashboard provides a foundation for more informed marketing decisions. By connecting marketing activity, pipeline progression, and revenue outcomes within a single reporting framework, the system enables organizations to evaluate channel performance, test optimization strategies, and continuously improve marketing investment efficiency.
Oops! Something went wrong while submitting the form